Install
The ACI EnhancedEndpointTracker can be installed directly on the APIC as an ACI app or deployed as a standalone application hosted on a baremetal or virtual machine.
ACI Application
The application can be deployed on the APIC. There are two modes supported, both available on ACI Appcenter.
- mini is backwards compatible with APIC 2.x and 3.x. However, there are memory constraints that limit the supported scale
- full scale application supported on APIC 4.x and above.
After downloading the app, follow the directions for uploading and installing the app on the APIC:
Note
Ensure you select security domain all when installing on the APIC
In you are executing the mini app, the APIC will enforce a 2G memory limit and a 10G
disk quota. As a result, it may crash if there are a large number of endpoints or high number
events per second. As a best practice, it is recommended to deploy in full mode or
standalone mode if the total number of per-node endpoints exceeds 32k. You can determine
the per-node endpoint count via the following moquery on the APIC:
apic# moquery -c epmDb -x query-target=subtree -x target-subtree-class=epmIpEp,epmMacEp,epmRsMacEpToIpEpAtt -x rsp-subtree-include=count
If running mini mode and it is exceeding the memory limits, you may see the symptoms below:
- Consistent monitor restarts due to “subscriber no longer running”
- Monitor restart due to “worker ‘w0’ not longer active”
- Monitor stuck or restarting during “getting initial endpoint state”
Standalone Application
The standalone app is one that runs on a dedicated host/VM and makes remote connections to the
APIC opposed to running as a container on the APIC. For large scale fabrics or development
purposes, standalone is the recommended mode to run this application. The standalone app also has
a few different deployment options:
all-in-oneis a single container with all required processes running. This is similar tominimode executing on the APIC, however the memory and compute restrictions are based on the host device and therefore can support much larger scale. This is the easiest way to deploy the app as it can be started with a single command.clusteruses a distributed architecture to execute multiple container across one or more nodes. This allows the app to scale with the size of the fabric. This is similar to thefullmode executing on the APIC but can be deployed in any custom environment that supports container orchestration.If you are deploying the cluster with more than one node, ensure there is connectivity between each node in the cluster and the following ports are allowed:
- TCP port 2377 for cluster management
- TCP and UDP port 7046 for communication between nodes
- UDP port 4789 for overlay traffic
- TCP port 22 for auto-deployment and setup
All-in-One Mode
To execute in all-in-one mode, you need a host with docker installed. See the
Docker documentation for installing docker on your host.
Once installed, execute the following command to download the EnhancedEndpointTracker docker image
and run it:
host$ docker run --name ept -p 5000:443 -d agccie/enhancedendpointtracker:latest
The command will start an instance of EnhancedEndpointTracker with the web server running on port 5000. Login to the web UI at https://localhost:5000. See the usage section for further details regarding how to use the app.
Cluster Mode - OVA
The EnhancedEndpointTracker app can be deployed in a distributed cluster. Users can deploy in their own cluster or use a prebuilt OVA. This section will focus on the OVA.
Note
Please send an email to aciappcenter-support@external.cisco.com to request a temporary download link for the EnhancedEndpointTracker OVA.
- The recommended sizing for the VM is as follows:
- 8 vCPU
- 16G memory
- 75G harddisk, thick provisioned
- The OVA contains the following components preinstalled:
- Ubuntu 18.04.2 LTS
- OpenSSH
- Docker CE 18.09.02
- Python 2.7.15rc1
- Network manager
- EnhancedEndpointTracker docker image specific to the version of the OVA
- A copy of the EnhancedEndpointTracker source code located in /opt/cisco/src directory
To get started with the OVA, perform the following steps:
Configure Host Networking
Once the OVA is deployed, access the console with the credentials below. Note, you will be required to change the password on first login.
- username: eptracker
- password: cisco
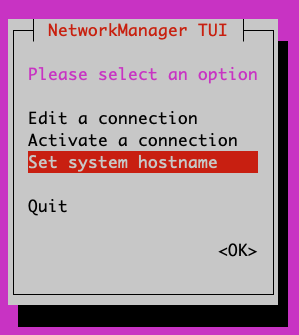
The OVA is simply a Ubuntu 18.04 install. Users can use any mechanism they prefer to initialize the network. The example below uses network manager TUI which is preinstalled on the host.
- Enter sudo nmtui
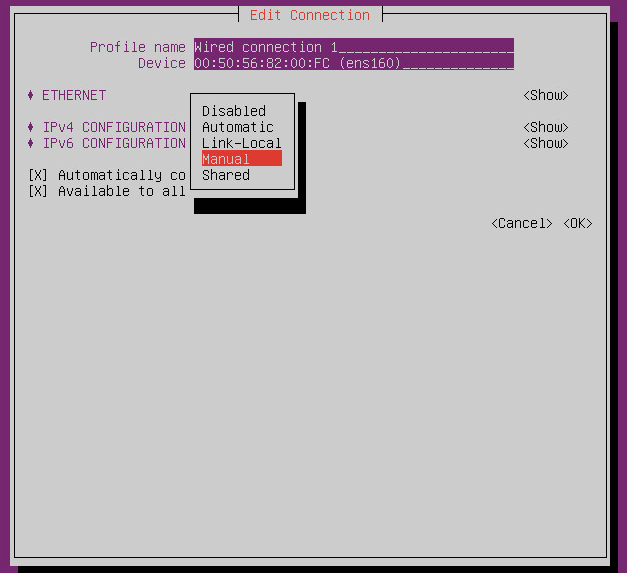
- Choose ‘Edit a connection’

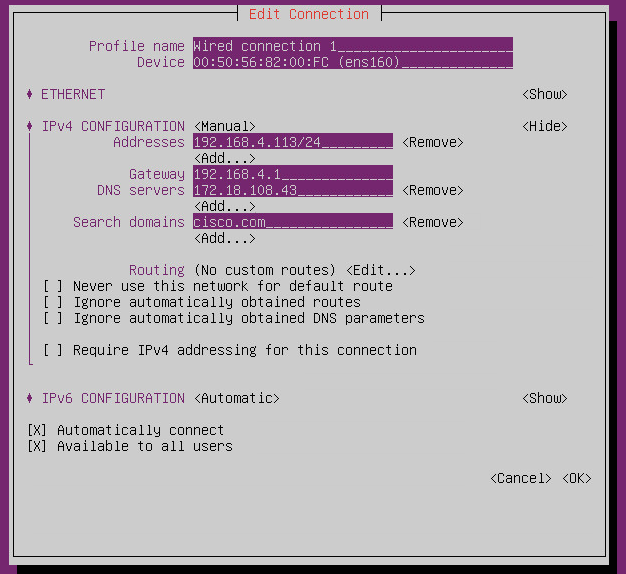
- Edit the appropriate connection. By default, the connection type is likely Automatic (DHCP) but if you need to set a static IP address you will need to change the mode to Manual and the set the appropriate info.
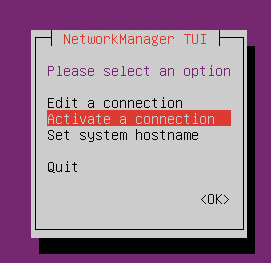
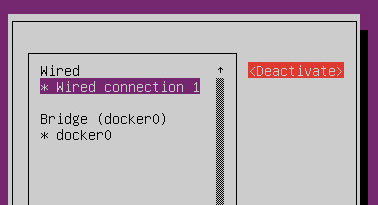
- To apply the updated configuration, you will need to deactivate and then activate the configured interface.
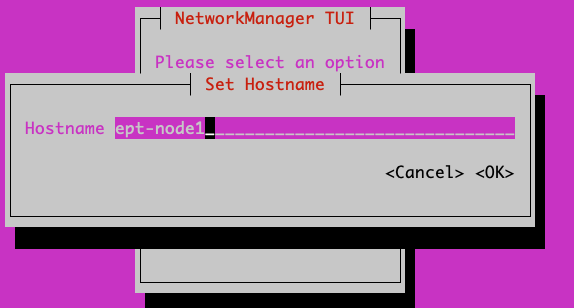
- Ensure you also set the hostname for the host. You will need to logout and log back in to see the hostname updated.
Configure NTP and Timezone
All timestamps for the app are based on the timestamp of the server itself. If you are running the app on a cluster with more than 1 node or if the time on the host is unreliable, then timestamps for events and analysis may be incorrect. Use timedatectl to configure your timezone and the ntp servers.
List the available options and set to the desired timezone.
eptracker@ept-node1:~$ timedatectl list-timezones | grep New
America/New_York
America/North_Dakota/New_SalemA

eptracker@ept-node1:~$ sudo timedatectl set-timezone America/New_York
Use vim or your favorite editor to set the required NTP servers under /etc/systemd/timesyncd.conf
eptracker@ept-node1$ sudo vim /etc/systemd/timesyncd.conf
Uncomment the NTP line and add the appropriate list of NTP servers. For example:
eptracker@ept-node1$ cat /etc/systemd/timesyncd.conf | egrep -A 1 Time
[Time]
NTP=172.16.1.1
Restart the ntp process and validate the configuration was successful. Note, it may take several a few minutes before ntp synchronizes the clock:
eptracker@ept-node1:~$ sudo timedatectl set-ntp true
eptracker@ept-node1:~$ sudo systemctl restart systemd-timesyncd

  eptracker@ept-node1:~$ timedatectl status
                        Local time: Wed 2019-03-13 12:26:50 EDT
                    Universal time: Wed 2019-03-13 16:26:50 UTC
                          RTC time: Wed 2019-03-13 16:26:51
                         Time zone: America/New_York (EDT, -0400)
         System clock synchronized: yes
  systemd-timesyncd.service active: yes  <--------- synchronized
                   RTC in local TZ: no
Configure the Cluster and Deploy the Stack
cluster mode with the OVA uses docker swarm for the overlay and network orchestration. Even if
there is only a single node, the swarm needs to be configured. Before starting, ensure that
networking has been configured on all nodes and they are able to communicate on the ports previously
listed.
All containers deployed in the stack rely on the agccie/enhancedendpointtracker:<version>
container. This is available on docker hub and is also available pre-installed on the OVA. There
is no internet requirement to get the app deployed on the OVA.
Step 1: Use the
app-deployscript to initialize the cluster and deploy the appThe
app-deployscript performs the following operations- Configure the host as a swarm leader
- Export the manager token to all other nodes and add them to the swarm
- Add a label called ‘node’ with the appropriate node number to each node in the cluster. The docker compose file uses the node labels to ensure the db shards and replicas are properly distributed.
- Create the docker compose file based on the desired number of shards, replicas, and workers distributed across the cluster nodes.
- Deploy the stack.
The default swarm configuration is in the
/opt/cisco/src/cluster/swarm/swarm_config.ymlfile. You can edit this file before deploying the stack to adjust worker count, db scale, adjust which port the web service is deployed, and enable/disable http. Additionally, you can pass in arguments for worker count and db configuration which will override the swarm_config.# example deployment with large scale (default worker/shard/memory is sufficent for most setups) eptracker@ept-node1:~$ app-deploy --deploy --worker 23 --db_shard 3 --db_replica 3 --db_memory 2.0 Number of nodes in cluster [1]: 3 UTC 2019-04-27 13:19:39.251||INFO||loading config file: /opt/cisco/src/cluster/swarm/swarm_config.yml UTC 2019-04-27 13:19:40.018||INFO||compose file complete: /tmp/compose.yml UTC 2019-04-27 13:19:41.038||INFO||initializing swarm master Enter hostname/ip address for node 2: 192.168.4.112 <--- you will be prompted for node IP Enter hostname/ip address for node 3: 192.168.4.113 Enter ssh username [eptracker]: <--- you will be prompted for credentials Enter ssh password: UTC 2019-04-27 13:19:59.752||INFO||Adding worker to cluster (id:2, hostname:192.168.4.117) UTC 2019-04-27 13:20:02.670||INFO||Adding worker to cluster (id:3, hostname:192.168.4.118) UTC 2019-04-27 13:20:04.540||INFO||docker cluster initialized with 3 node(s) UTC 2019-04-27 13:20:04.541||INFO||deploying app services, please wait... UTC 2019-04-27 13:30:07.130||INFO||2 services pending, re-check in 60.0 seconds UTC 2019-04-27 13:31:07.483||INFO||app services deployed UTC 2019-04-27 13:31:22.499||INFO||deployment complete
Note
The app-deploy script requires that all nodes in the cluster have the same
username/password configured. Once the deployment is complete, you can set unique
credentials on each node.
Tip
The app-deploy script is simply an alias to /opt/cisco/src/cluster/deploy.py
script with some auto-detection for which version to deploy based on the version of the OVA.
Step 2: Manager the App via the web-GUI
After deployment is complete, open a web browser to the IP address of any node in the cluster. Using the example above we could access the app on node-3 via to https://192.168.4.113/. The app can be fully managed from the UI. See the usage section for further details regarding how to use the app.
Cluster Mode Manual
Users may prefer to manually configure the cluster in any environment that supports container
orchestration. Deploying each container requires the container image which can be pulled from
docker hub or manually built using the
Dockerfile on github.
Once built, the entry point for the container must be /home/app/src/Service/start.sh and
appropriate arguments and environmental variables are required.
Manually Deploying Cluster Mode with Docker Swarm
This section provides an example for manually deploying cluster mode with docker swarm. This example uses ubuntu 18.04 with docker 18.09.2. It could be extended to support other docker orchestration environments such as Kubernetes or Nomad. Refer to Container Arguments and Environmental Variables for more info on required settings for manually deploying a container.
Note
These steps assume a linux host or VM. Using docker swarm to deploy a stack on MACOS or Windows has not been tested and may not work as expected.
Step 1: Install Docker
Further instructions for install docker on your docs.docker.com.
# update apt and install required packages
sudo apt-get update && sudo apt-get install \
    apt-transport-https \
    ca-certificates \
    curl \
    gnupg-agent \
    software-properties-common

# add Docker's official GPC KEY and setup the stable docker repository
curl -fsSL https://download.docker.com/linux/ubuntu/gpg | sudo apt-key add -
sudo add-apt-repository \
    "deb [arch=amd64] https://download.docker.com/linux/ubuntu \
    $(lsb_release -cs) \
    stable"

# update apt and install docker
sudo apt-get update
sudo apt-get install \
    docker-ce=5:18.09.2~3-0~ubuntu-bionic \
    docker-ce-cli=5:18.09.2~3-0~ubuntu-bionic containerd.io

# add your username to docker group to run docker commands without root (required logout)
sudo usermod -aG docker eptracker
Step 2: Install python and pull automation scripts
This step is only required if you are using the provided automation scripts to automate deployment of the cluster and service stack. If you are using your own docker orchestration, then this step can be skipped.
# install python and python-pip
sudo apt install git python python-pip

# pull the source code in dedicated directory and change ownership to 'eptracker'. Ensure
# you substitute the username with your username.
sudo mkdir -p /opt/cisco/src
sudo chown eptracker:eptracker /opt/cisco/src -R
git clone https://github.com/agccie/ACI-EnhancedEndpointTracker.git /opt/cisco/src

# install build python requirements
sudo pip install -r /opt/cisco/src/build/requirements.txt
Note
If you installed python and build requirements you can automate all remaining steps. I.e., you can configure the swarm AND create the compose file AND deploy the full stack with a single command. Refer to Configure the Cluster and Deploy the Stack for more info
python /opt/cisco/src/cluster/deploy.py --deploy
Step 3: Configure the Docker Swarm
Docker Swarm consist of one or more managers and one or more workers. For redundancy there should be multiple manager processes. The manager process can also be used to run containers or just for monitoring/managing the swarm. In this example, we will deploy on only three nodes which will all be managers. Note you can skip this step if you used the deploy script in Step 2.
# intialize node-1 as the swarm master with 10 year certificate
eptracker@ag-docker1:~$ docker swarm init --cert-expiry 87600h0m0s
Swarm initialized: current node (s6pbhtb34ttvv7f1k35df855l) is now a manager.
<snip>

# get the manager token to use for other managers in the cluster
eptracker@ag-docker1:~$ docker swarm join-token manager
To add a manager to this swarm, run the following command:
    docker swarm join --token SWMTKN-1-4ef1xrfmosdecb5i4ckm6t4v1rdr95wkbdej4nla0d35mr3i8x-aad8vucl9lfjs65x3whe23upg 192.168.2.78:2377

# assuming docker has been installed on node-2 and node-3, add them to the cluster as managers
eptracker@ag-docker2:~$ docker swarm join --token SWMTKN-1-4ef1xrfmosdecb5i4ckm6t4v1rdr95wkbdej4nla0d35mr3i8x-aad8vucl9lfjs65x3whe23upg 192.168.2.78:2377
This node joined a swarm as a manager.

eptracker@ag-docker3:~$ docker swarm join --token SWMTKN-1-4ef1xrfmosdecb5i4ckm6t4v1rdr95wkbdej4nla0d35mr3i8x-aad8vucl9lfjs65x3whe23upg 192.168.2.78:2377
This node joined a swarm as a manager.
Now that the swarm is initialized, verify that all nodes are available and are active.
eptracker@ag-docker1:~$ docker node ls
ID                            HOSTNAME            STATUS              AVAILABILITY        MANAGER STATUS      ENGINE VERSION
s6pbhtb34ttvv7f1k35df855l *   ag-docker1          Ready               Active              Leader              18.09.2
5flk9lvtppjoopugcp0ineo8l     ag-docker2          Ready               Active              Reachable           18.09.2
oqcg9okajvgm2l0x74bqsh043     ag-docker3          Ready               Active              Reachable           18.09.2
The compose file used in this example will pin various db components to different nodes in the cluster using a docker placement constraint. For this functionality to be successful, we need add appropriate node labels to each node in the cluster. This can be executed on any master node in the swarm.
# set the node label for each node in the swarm
eptracker@ag-docker1:~$ docker node update --label-add node=1 ag-docker1
eptracker@ag-docker1:~$ docker node update --label-add node=2 ag-docker2
eptracker@ag-docker1:~$ docker node update --label-add node=3 ag-docker3

# validate the node label is present
eptracker@ag-docker1:~$ docker node inspect ag-docker1 --format '{{ .Spec.Labels }}'
map[node:1]
eptracker@ag-docker1:~$ docker node inspect ag-docker2 --format '{{ .Spec.Labels }}'
map[node:2]
eptracker@ag-docker1:~$ docker node inspect ag-docker3 --format '{{ .Spec.Labels }}'
map[node:3]
Step 3: Create the compose file to start the stack
In this example will use the swarm_config.yml referenced in Configure the Cluster and Deploy the Stack combined with the automation scripts to create the compose file. Again, refer to Container Arguments and Environmental Variables for required settings if you are manually creating a swarm configuration file.
# use --help for more options. Use --version for specific version else latest image is used.
eptracker@ag-docker1:~$ python /opt/cisco/src/cluster/deploy.py --config [--version 2.0.12]
eptracker@ag-docker1:~$ python /opt/cisco/src/cluster/deploy.py --config
Number of nodes in cluster [1]: 3
EST 2019-02-28 18:08:07.029||INFO||loading config file: /opt/cisco/src/cluster/swarm/swarm_config.yml
EST 2019-02-28 18:08:07.135||INFO||compose file complete: /tmp/compose.yml

# verify compose file is present
eptracker@ag-docker1:~$ more /tmp/compose.yml
        networks:
          default:
            ipam:
              config:
              - subnet: 192.0.2.0/24
        services:
          db:
            command: '/home/app/src/Service/start.sh -r db -l '
            deploy:
              mode: global
            environment:
            - DB_CFG_SRV=cfg/db_cfg_0:27019,db_cfg_1:27019,db_cfg_2:27019
            - DB_RS_SHARD_0=sh0/db_sh_0_0:27017,db_sh_0_1:27017,db_sh_0_2:27017
            - DB_RS_SHARD_1=sh1/db_sh_1_0:27017,db_sh_1_1:27017,db_sh_1_2:27017
            - DB_RS_SHARD_2=sh2/db_sh_2_0:27017,db_sh_2_1:27017,db_sh_2_2:27017
            - DB_SHARD_COUNT=3
            - HOSTED_PLATFORM=SWARM
            - MONGO_HOST=db
            - MONGO_PORT=27017
            - REDIS_HOST=redis
            - REDIS_PORT=6379
            - LOCAL_REPLICA=0
            - LOCAL_SHARD=0
            - LOCAL_PORT=27017
            - DB_MEMORY=2.0
            - DB_ROLE=mongos
            image: agccie/enhancedendpointtracker:latest
            logging:
              driver: json-file
              options:
                max-buffer-size: 1m
                max-file: '10'
                max-size: 50m
                mode: non-blocking
            volumes:
            - db-log:/home/app/log
<snip>
Step 4: Deploy the stack and verify
The final step is to deploy the stack and verify all services are operational. This can be done on any master node. The syntax for the command is docker stack deploy -c <compose file> <stack name>
# deploy the stack
eptracker@ag-docker1:~$ docker stack deploy -c /tmp/compose.yml ept
Creating network ept_default
Creating service ept_db_sh_1_0
Creating service ept_db
Creating service ept_web
Creating service ept_redis
<snip>
Next verify that all required services are running. From the output below we can see the number of configured replicas for each service, the number successfully running, and the external exposed ports. We expect 1/1 for most replicas and the ept_web service exposed on port 80 and port 443.
# stack is running with 27 services
eptracker@ag-docker3:~$ docker stack ls
NAME                SERVICES            ORCHESTRATOR
ept                 27                  Swarm

# verify all services are running
eptracker@ag-docker1:~$ docker service ls
ID                  NAME                MODE                REPLICAS            IMAGE                                   PORTS
1y1vauo1yahi        ept_db              global              3/3                 agccie/enhancedendpointtracker:latest
2r53aefqghyf        ept_db_cfg_1        replicated          1/1                 agccie/enhancedendpointtracker:latest
m7ryoimptzbt        ept_db_cfg_2        replicated          1/1                 agccie/enhancedendpointtracker:latest
vkqz5h2np5bt        ept_db_sh_0_0       replicated          1/1                 agccie/enhancedendpointtracker:latest
ofd174ixmeem        ept_web             replicated          1/1                 agccie/enhancedendpointtracker:latest   *:80->80/tcp, *:443->443/tcp
<snip>

# further inspection to determine which node a specific service is running
eptracker@ag-docker1:~$ docker service ps ept_mgr
ID                  NAME                IMAGE                                   NODE                DESIRED STATE       CURRENT STATE           ERROR               PORTS
yvq6uunapsh1        ept_mgr.1           agccie/enhancedendpointtracker:latest   ag-docker2          Running             Running 5 minutes ago
The application stack has successfully been deployed.
Container Arguments
This section lists the available arguments to the /home/app/src/Service/start.sh startup script
which executed by default when starting the container.
-r role
The role for the container to execute. There are several different roles required for the app to execute correctly. See Components for more details. The allowed rows as follows:
all-in-one(default role) all-in-one starts all required processes within the same container. This can be combined withcountoption to adjust the number of workers. This mode runs a single instance of mongo with no sharding support.
webweb role will run the apache web process on port 80 and 443 with a self-signed certificate. Additional docker arguments can be included to expose these ports on whatever external ports are required.
rediswill run a single instance of redis on REDIS_PORT which defaults to 6379
dbruns a single instance of mongo v3.6.10. There are several required environmental variables. If not provided the container will restart.
- DB_ROLE
- DB_SHARD_COUNT
- DB_CFG_SRV
- DB_MEMORY
- LOCAL_PORT
- LOCAL_REPLICA
- LOCAL_SHARD
mgrruns an instance of manager process. There should only be a single instance of manager running for the entire application. The manager is also responsible for initializing the db cluster and therefore requires the following environment variables previously defined withindbrole:
- DB_CFG_SRV
- DB_SHARD_COUNT
watcherruns single instance of the watcher process with providedidentity. watcher will also start exim4 process used for sending email notifications, if configured.
workerruns one or more instances of worker process. The worker process usescountoption to set the number of worker instances running within the container. Theidentityassigned to each worker is relative to the initialidentityprovided. For example, if an id of 5 is assigned to the worker and a count of 3 is provided, then there will be three workers started in the container with id’s 5, 6, and 7.It is recommended to use
-c 1when executing the worker role.
-i identity
unique integer identity required for mgr, watcher, and worker components.
Note
Ensure that there are no overlapping identities per role. A duplicate id will result
in race conditions that can trigger invalid analysis.
-c count
count is an integer for the number of workers to run within a single container. This is applicable
to all-in-one and worker roles only.
-l log-rotation
enables log rotation within the container. If an external component is managing log rotation or you
are using stdout for all logging then this is not required.
Warning
the application can perform extensive logging. If there is no component performing the log rotation then -l should be provided.
Note
all logs are saved to /home/app/log or a sub folder within this directory.
-s stdout
enables all logging to stdout. Note that stdout is not currently supported with web role.
Environmental Variables
There are several required environmental variables depending on which role the container is
executing.
- HOSTED_PLATFORM
- Should be statically set to SWARM. This is required for proper creation of various config instance files. This should be set on all containers.
- MONGO_HOST
- the hostname of the
dbrole with DB_ROLE = mongos. This should be set on all containers. - MONGO_PORT
- the LOCAL_PORT number of the
dbrole with DB_ROLE = mongos. This should be set on all containers. - REDIS_HOST
- the hostname of the redis role container. This should be set on all containers.
- REDIS_PORT
- the port number where redis is exposed. This should be set on all containers.
- DB_ROLE
- The role can be
mongos,configsvr, orshardsvr. The application requires at least one instance of each. If running as configsvr, the replica set name is statically configured as cfg. If running as a sharsvr, the replcia set is statically configured as ‘sh$LOCAL_SHARD’ where shard number starts at 0. - DB_SHARD_COUNT
- the number of db shards. This is used by mgr process during db init.
- DB_CFG_SRV
- used by mongos instance to connect to configsvr replica set. This will be in the format
cfg/<configsvr0-hostname:configsvr0-port, ...>. For example, if there is a replica set of 3 config servers each exposed on port 27019 with hostname db_cfg_0, db_cfg_1, db_cfg_2, then DB_CFG_SVR should be set tocfg/db_cfg_0:27019,db_cfg_1:27019,db_cfg_2:27019 - DB_MEMORY
- Amount of memory this instance of mongo is allowed to use. This is measured in GB and can be a float. For example, 1.5 would limit mongo instance to 1.5 GB of memory.
- LOCAL_PORT
- local tcp port to expose running instance of mongo
- LOCAL_REPLICA
- replica number for this mongo instance. LOCAL_REPLICA should be set to 0 for mongos role. The configsvr and shardsvr are each deployed in replica sets so each instance will have a LOCAL_REPLICA starting at 0.
- LOCAL_SHARD
- shard number for shardsvr instance. For mongos and configsvr this should be set to 0.