Usage
Fabric Monitor Settings
The application can be configured to monitor multiple ACI fabrics. You can setup a fabric to monitor by clicking on the New Fabric button on the home page and then fill out the form. For existing monitors, you can click the fabric  button.
The options for each monitor are below:
Unique Fabric NameThe fabric name is used locally by endpoint tracker to distinguish between multiple fabrics. It must be a string between 1 and 64 characters and cannot be changed once configured. A short name such as fab1 and fab2 is recommended.APIC HostnameThe hostname or IP address of a single APIC in the cluster. The application will use this IP to discover all other APICs in the cluster. If the initial APIC becomes unreachable, the other discovered APICs will automatically be used. Only out-of-band IPv4 address is currently supported for dynamic discovery of other APICs.APIC CredentialsAPIC username and password. User must have admin read access.Switch SSH CredentialsCurrently there is no API to clear an endpoint from a leaf. This application will SSH to the leaf and manually clear the endpoint. A username and password with ssh access to the leaf is only required if you need to clear endpoints within the app. The application can be set to ssh to the leaf TEP via the APIC or SSH directly to the switch out-of-band address.- The
Notification OptionsThe application can send syslog or email notifications for different events. At this time only one syslog server and one email address can be provided. If no value is configured then the application will not send any notification. Click the button to select which types of notifications to be sent for each notification method:
 - Endpoint Move
- Endpoint is becomes Stale on one or more leaves
- An off-subnet endpoint is learned
- The
RemediateThe application can remediate potentially impacting endpoints by clearing them from the affected nodes. Remediate options are disabled by default but can be enabled under the fabric settings:- Automatically clear stale endpoints
- Automatically clear off-subnet endpoints
Advanced SettingsClick the button for advanced settings. Generally these settings do not need to be changed unless needed for high scale environments.- perform endpoint move analysis
- perform endpoint stale analysis
- perform endpoint off-subnet analysis
max_ep_eventsmaximum number of historical records per endpoint. When this number is exceeded, older records are discardedmax_workersmaximum number of worker processesmax_jobsmaximum queue size of pending events to processes. When this number is exceeded, the fabric monitor is restartedmax_startup_jobsmaximum queue size of pending events to processes on initial endpoing build. When this number is exceeded, the fabric monitor is restartedmax_fabric_eventsmaximum number of fabric monitor events. When this number is exceeded, older records are discarded
Note
When running in app-mode the fabric is automatically discovered when the app is installed on the APIC. The fabric name defaults to the controller fbDmNm, the APIC hostname is the docker gateway (172.17.0.1 on most setups), and the APIC credentials user the app username with APIC created certificate. Only one fabric can be monitored in app-mode
Warning
There is a 2G memory set on the docker container while running in app-mode. Increasing the default max_jobs or max_startup_jobx can cause the application to crash. If fabric scale requires higher thresholds, consider moving application from app-mode to standalone mode.
Controlling the Monitors
Once the fabric has been configured, you can view and control the status from the home page. Use the following buttons to control the fabric:
 Start/Restart the monitors for the fabric
 Stop the monitors for the fabric
- Edit the fabric monitor settings
 Refresh the status of all fabric monitors along with Top and Recent events
 View history events of the fabric monitor.
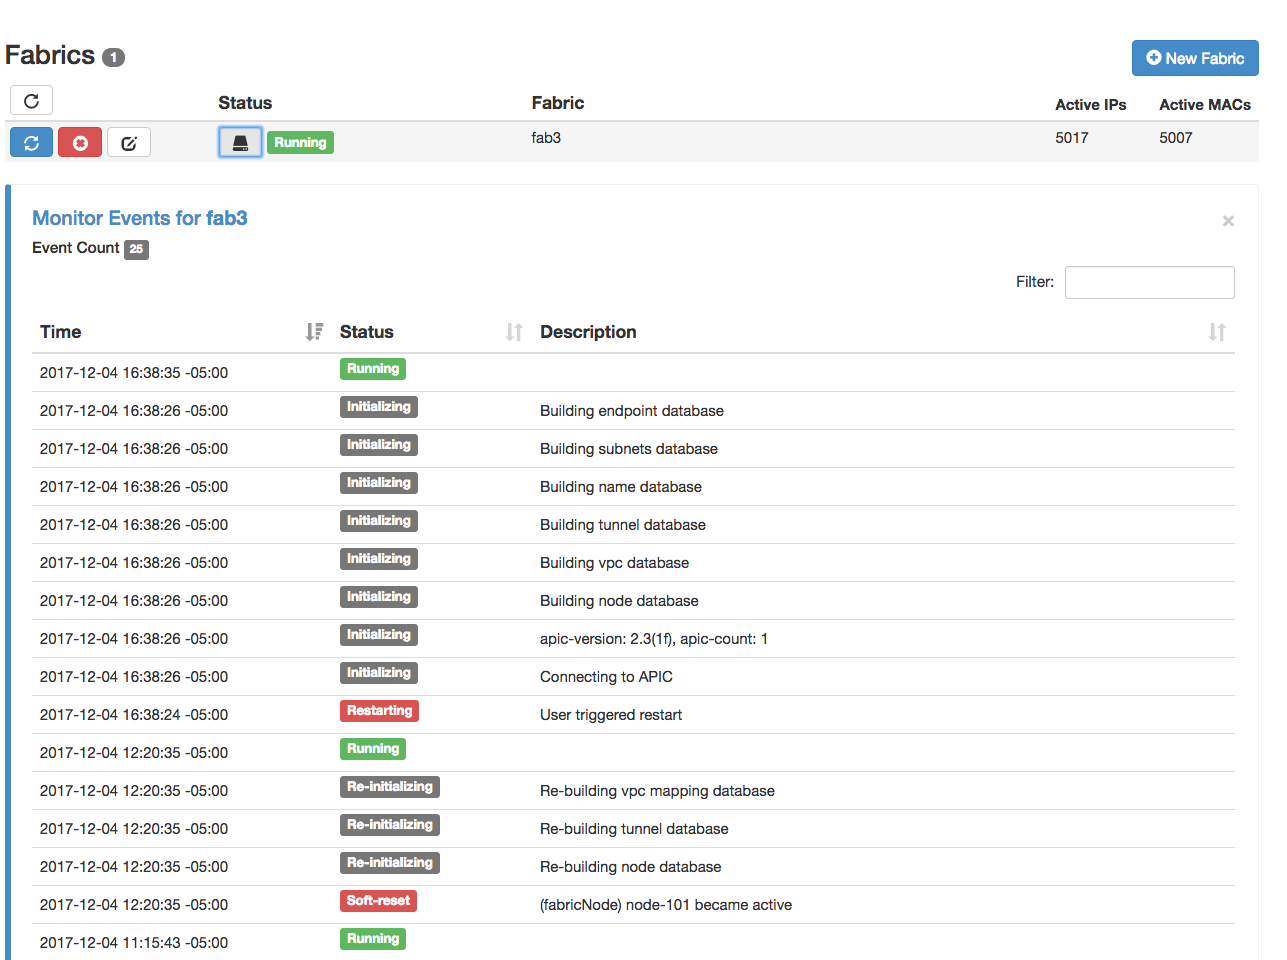
Fabric Monitor History
The fabric monitor can be manually started or restarted. In addition, the monitor may restart if a new node comes online, a threshold such as max_jobs is exceeded, or a worker process has crashed. The history of restart events can be seen by clicking the button. For example:
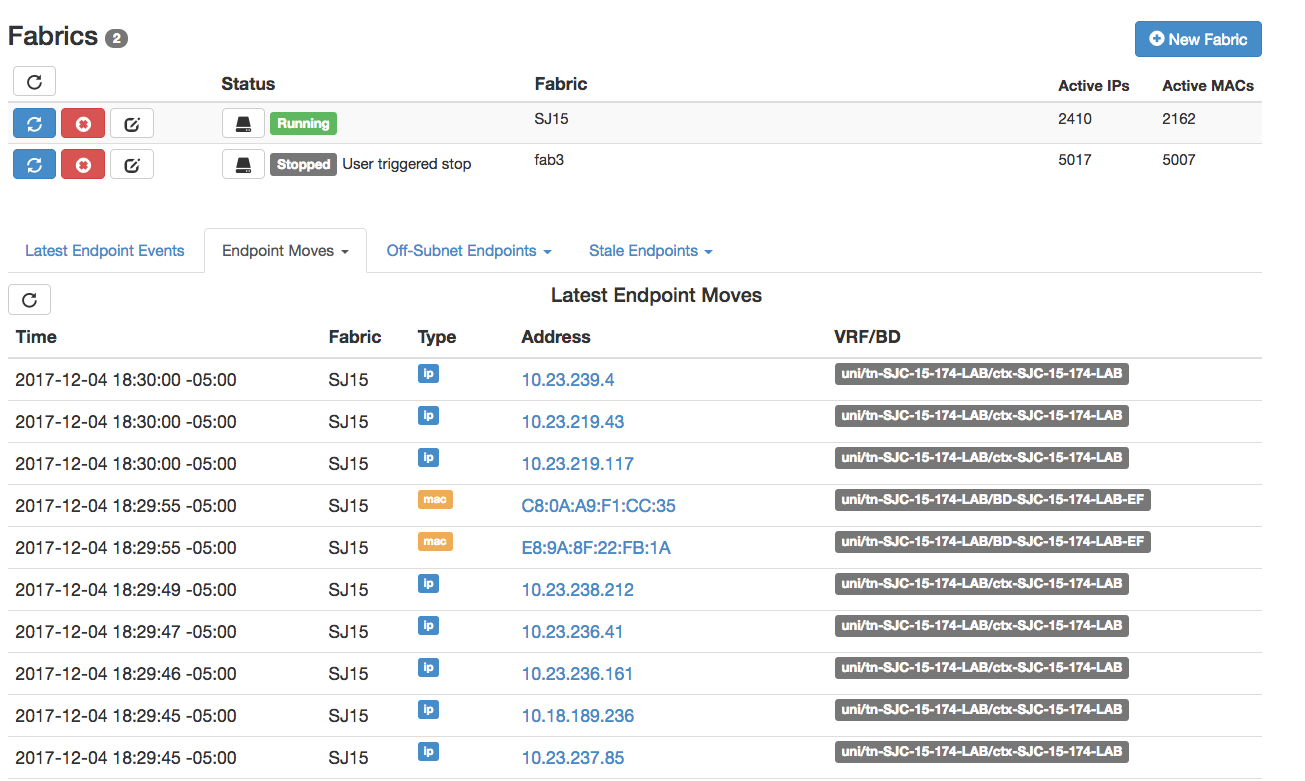
Fabric Overview
The fabric overview can be seen on the home page as soon as one or monitors are configured. The overview contains the last 50 records for the following events:
Latest Endpoint Events- Each time an endpoint is created, deleted, or modified on a node the corresponding record will be created in theep_historytable. The most recent events are displayed here.Latest Moves- On each endpoint event, ifanalyze_moveis enabled, a move analysis is performed. If the node, ifId, encap, pcTag, rw_bd, or rw_mac has changed between the last two local events, and the move is not a duplicate of the previous move, then a new entry is added to theep_movestable. The most recent moves from theep_movestable are displayed here.Top Moves- Each entry added to theep_movestable has a corresponding count. The entries in theep_movestable with the highest count are displayed here.Currently Off-Subnet Endpoints- On each IP endpoint event, ifanalyze_offsubnetis enabled, then analysis is performed to determine if endpoint is off-subnet. This is done by mapping the pcTag to bd_vnid via theep_epgstable and then checking the IP against list of subnets for the corresponding bd_vnid in theep_subnetstable. If the IP is determined to be off-subnet, then entry is marked withis_offsubnetflag in theep_historytable. A job is added to the watch queue to ensure endpoint is still off-subnet after the transitory_offsubnet_time (30 seconds). If theis_offsubnetflag has not been cleared, then anep_offsubnettable. The entries in theep_historytable withis_offsubnetflag set to True are display viaCurrently Off-Subnet EndpointsHistorical Off-Subnet Events- This displays the latest IP endpoints added to theep_offsubnettable.Currently Stale Endpoints- On each endpoint event, ifanalyze_staleis enabled, then analysis is performed to determine if the endpoint is stale on any node. This is performed by determining which node has learned the endpoint as a local entry (aware of vpc VTEP logic) and checking each node with an remote entry (XR) and ensuring it points back to the correct node. If the XR entry points to proxy or points to a node which has an XR bounce entry, this is also considered a correct learn. If the analysis determines the endpoint is stale, theis_staleflag is set in theep_historytable. A job is added to the watch queue to ensure the endpoint is still stale after the transitory_stale_time (30 seconds) or transitory_xr_stale_time (300 seconds) for entries that should be deleted from fabric. If theis_staleflag after the holdtime, then an entry is added to theep_staletable. The entries in theep_historytable withis_staleflag set to True are displayed viaCurrently Stale Endpoints.Historical Stale Endpoint Events- This displays the latest endpoints added to theep_staletable.