Usage
This section assumes EnhancedEndpointTracker has already been installed. Please refer to the Install for more details regarding installation steps. This page will cover general usage of the application. Note that some sections are specific to restricted to standalone mode only.
User Accounts
Note
This section is only applicable to standalone mode. In app mode the APIC handles all authentication and authorization requests.
Once the application is installed, the default credentials are as follows:
- username: admin
- password: cisco
You can click the Users ![]() icon at the top right of the page to modify credentials along
with adding and modifying users. The app supports an admin role which has full read and write
access along with a read-only user role. Refer to api for more details regarding required
role for each operation.
icon at the top right of the page to modify credentials along
with adding and modifying users. The app supports an admin role which has full read and write
access along with a read-only user role. Refer to api for more details regarding required
role for each operation.
Fabrics
Note
This section is only applicable to standalone mode. In app mode the fabric is auto discovered when the app is installed. Only one fabric will be monitored.
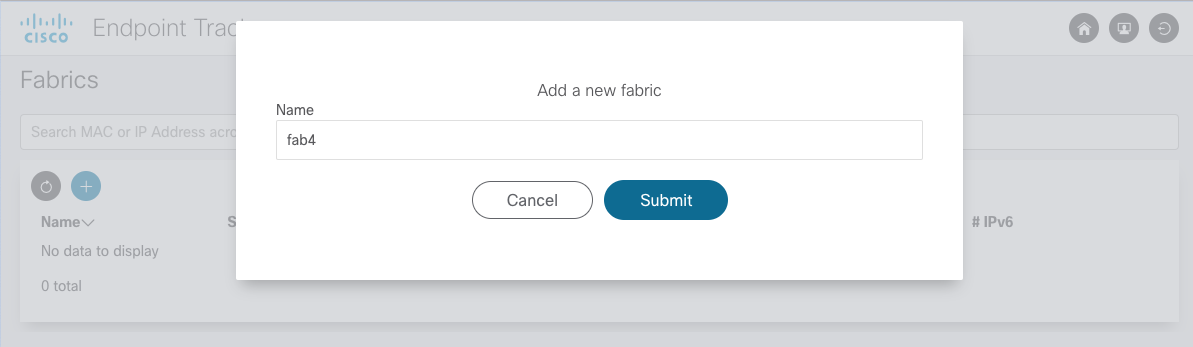
Click the Home ![]() icon to access the home page and add fabrics to monitor. Multiple fabrics
can be monitored by a single app and you can search for an endpoint from the Home page across all
fabrics. Simply click the Add icon and enter the fabric name. Once submitted you will be
redirected to the Settings page to further configure various monitoring options.
icon to access the home page and add fabrics to monitor. Multiple fabrics
can be monitored by a single app and you can search for an endpoint from the Home page across all
fabrics. Simply click the Add icon and enter the fabric name. Once submitted you will be
redirected to the Settings page to further configure various monitoring options.
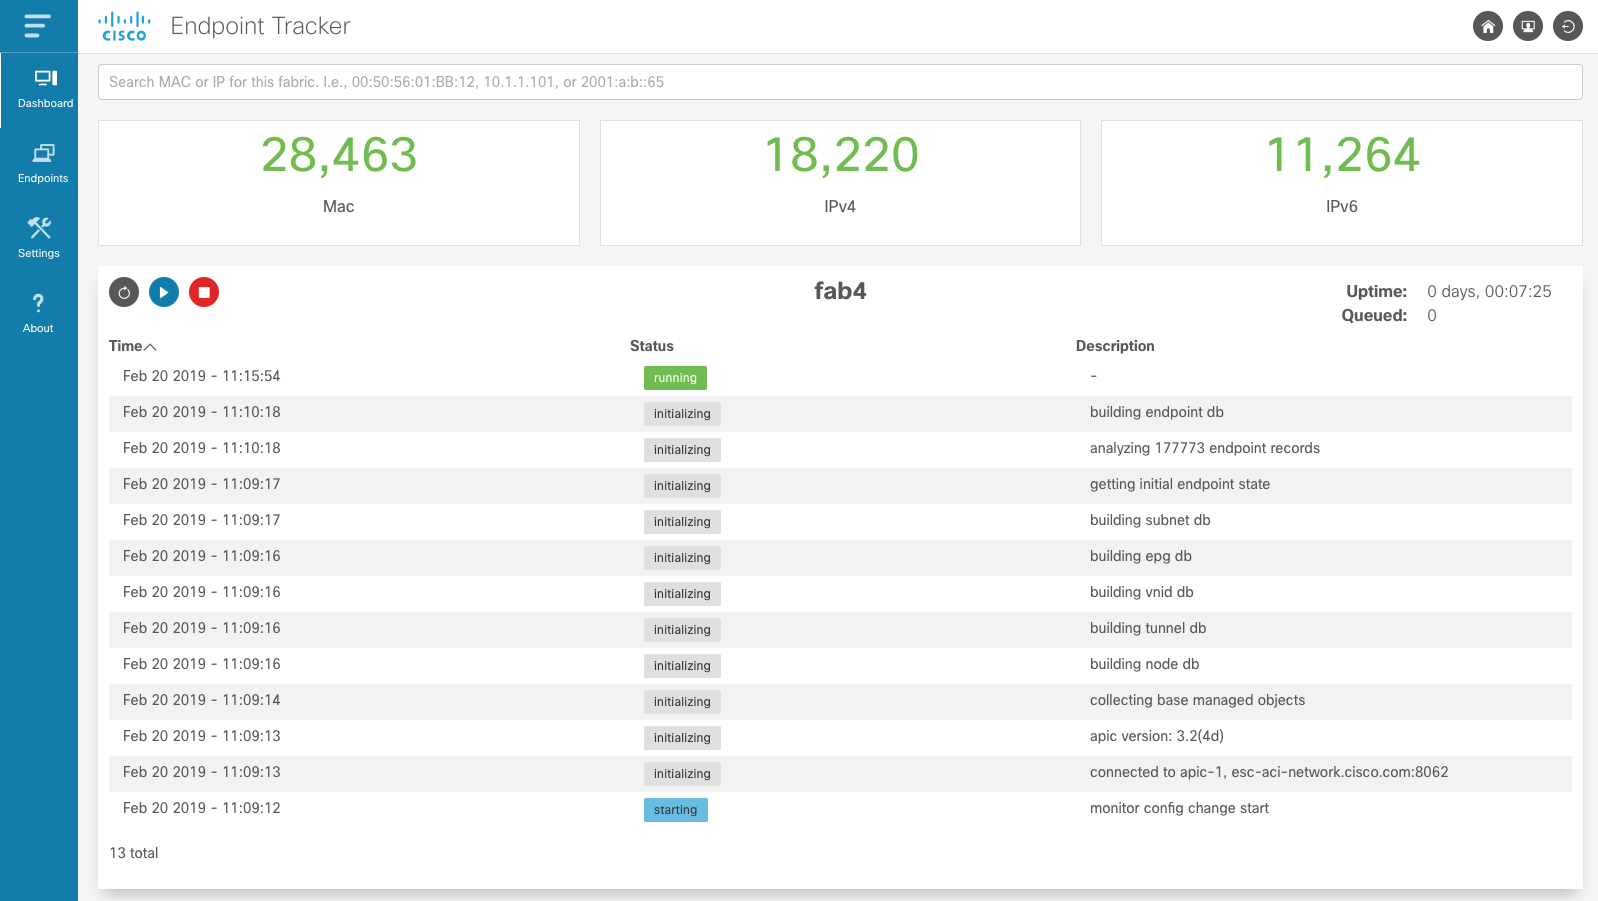
Dashboard
The dashboard page provides an overview of the current status of the fabric monitor. You can see an
overall count for the total number of active endpoints, a history of the fabric monitor events,
along with the uptime of the monitor. Operators can control the monitor via the Start ![]() and Stop
and Stop ![]() icons.
icons.
Tip
Loopback addresses and pervasive SVIs are tracked but are not considered as active endpoints within the fabric and do not count toward the total active count. Additionally, if an endpoint has been deleted the records remain within the database and can be searched/viewed but will not count toward the total active count.
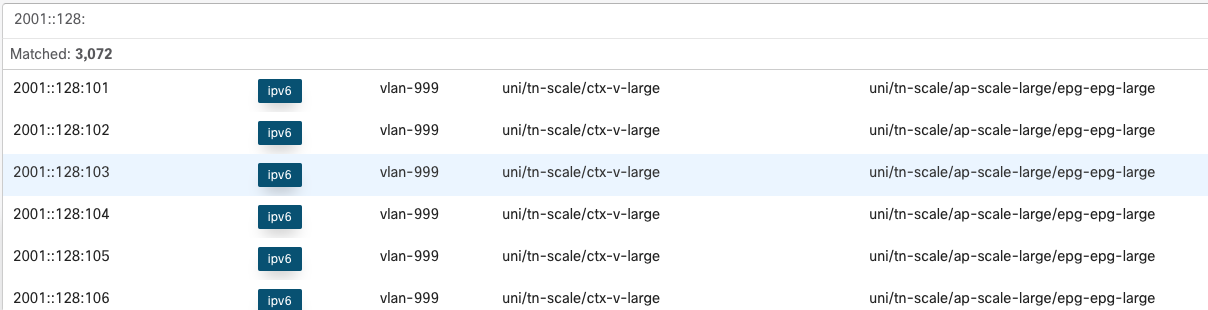
Operators can quickly find an endpoint of interest by typing in the corresponding MAC, IPv4, or IPv6 address in the search bar at the top of the page. The search returns the number of endpoints matched along with the full address, endpoint type, encapsulation, VRF name, and EPG name where the endpoint is learned.
If the fabric is not running or eptManager is not active, then an appropriate message is
displayed at the top of the Dashboard page.
Endpoints
There are several analyses performed and as a result several endpoint tables that can be viewed. Each page supports various filtering, a total count for number of endpoints matching filter, flexible sorting on attributes of interest, and resizable columns.
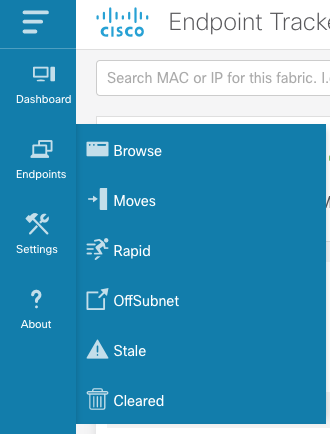
Browse allows operators to view the Current Endpoint State of for the fabric. Use this page to walk through all active endpoints, filter on currently offsubnet, stale, or rapid endpoints.
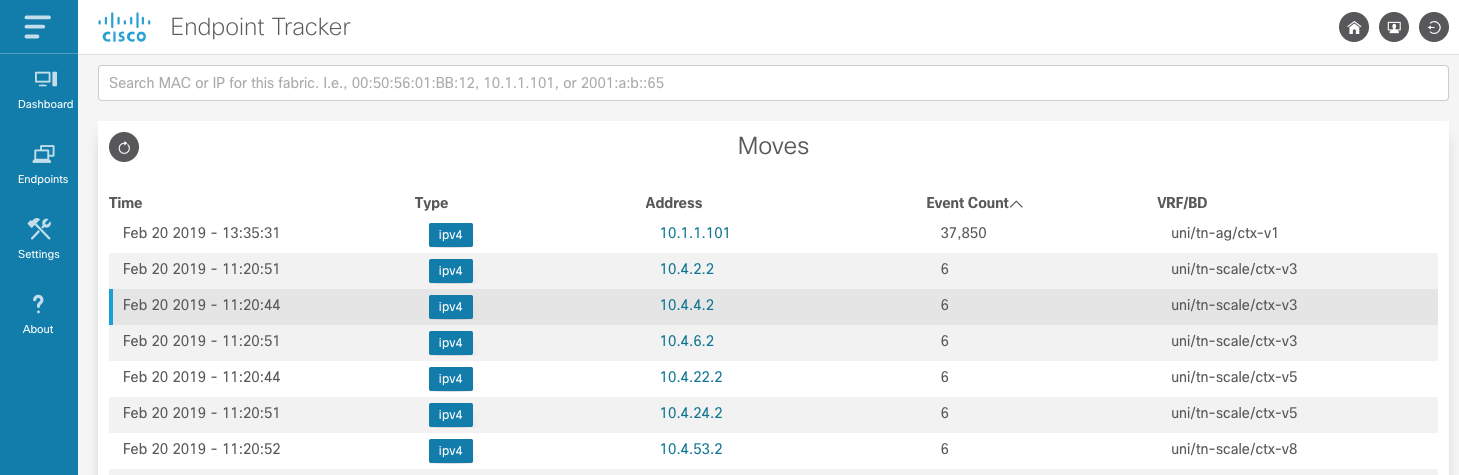
Moves shows all endpoints that have moved within the fabric. The table is sorted by most recent
event but can also be sorted based on available column. It is extremely useful to sorted based on
move event count which will show any endpoints that are unstable in the fabric. In the example below
we can see that 10.1.1.101 has moved 37k times which indicates we may have
a misconfiguration that needs to be addressed.
There are additional pages for Rapid, Offsubnet, Stale, and Cleared records. Each of these pages are historical records for past detection events. Similar to Moves, operators can sort and page through results as needed.
Endpoint Details
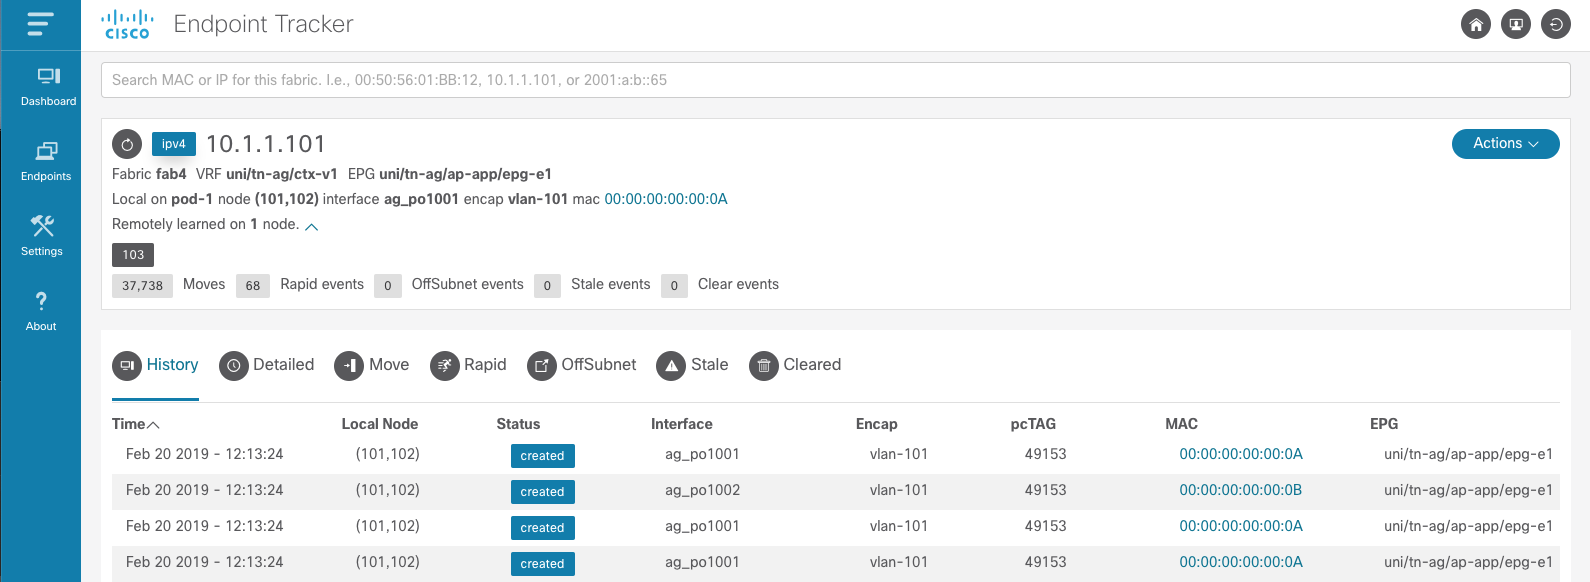
The power of the EnhancedEndpointTracker app is the Endpoint Detail page. This allows operators to see the current state of endpoint within the fabric along with the historical records of what has happened to the endpoint in the past. On the Overview section, the current state of the endpoint is listed. As seen in the example below, this includes the current location of the endpoint in the fabric including VRF, EPG, pod, node, interface, encap, and rewrite information. All nodes where the endpoint is remotely learned (XR) is also available. Also, a summary count of each event type that has occurred for this endpoint is displayed. If an endpoint is currently rapid, offsubnet, or stale it will be highlighted along with the list of affected nodes.
Tip
All columns are resizable. Simply click to the left of the column name and drag the column to make it wider.
- History displays the local learn events for the endpoint in the fabric along with delete events
- Detailed is a per-node history of events that has occurred for this endpoint. It provides an additional search bar to filter on a specific attribute such as node, epg, pcTag, etc… This is extremely helpful for experienced operators who need to know the state and history of the endpoint on a specific node.
- Move displays the move events for this endpoint. Each row has the source and destination for the move.
- Rapid displays the rapid events detected for this endpoint. The timestamp when the endpoint was flagged as rapid along with the total number of epm events at that instance and the calculated rate of events are also displayed
- OffSubnet displays offsubnet events detected for this endpoint. The affected node, interface, encap, and EPG are also displayed. It’s common that a misconfigured endpoint fails subnet check on the ingress leaf but still triggers a remote learn on another node. For this reason, the remote node column is available so operators know which leaf the offsubnet endpoint originated from.
- Stale displays stale events detected for this endpoint. Similar to the other tables, the affected node, interface, encap, EPG, and remote node are captured. Generally, a stale endpoint is a remote learn pointing to an incorrect leaf. This table includes the expected remote node at the time the stale event was detected.
- Cleared displays the timestamp and reason an endpoint was cleared from the fabric by this app.
There are a few actions that can be performed on an endpoint.
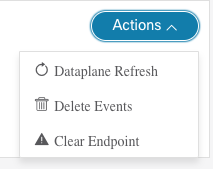
Dataplane Refresh will query the APIC for the most recent state of the endpoint in the fabric and update the app database. This is used as a sanity check to ensure that the state of the endpoint reported in the app is 100% correct. There is no impact to this operation but it does require that the fabric monitor is actively running.
Delete Events will delete the endpoint information from the app database. It has no impact on the fabric. This is a useful mechanism to delete historical information on endpoints you no longer care about. After the entry is removed from the app, a refresh is also triggered to ensure the app stays in sync with the fabric. Therefore, you may notice that after the delete the endpoint is immediately relearned by the app.
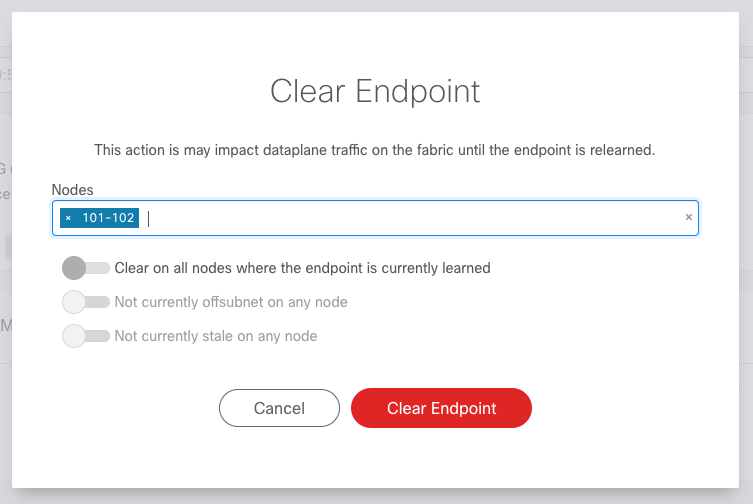
Clear Endpoint allows the operator to clear an endpoint from the fabric on one or more nodes. This operation requires SSH credentials are configured under the fabric Settings. When clearing an endpoint, operators can provided a list of nodes. Operators can also use the available toggles:
Clear on All Active Nodes will clear the endpoint on all nodes that currently have the endpoint learned. This includes both local learns and remote learns
Clear on All Offsubnet Nodes will clear the endpoint on all nodes that have currently learned the endpoint offsubnet
Clear on All Stale Nodes will clear the endpoint on all nodes that are currently stale.
Warning
Clearing the endpoint will trigger an EPM delete in the fabric. This can cause a traffic impact to the endpoint until it is relearned in the fabric.
Settings
The settings section is divided into multiple sub-sections. Ensure you click the Save ![]() icon to apply your changes. If you update the connectivity settings you will need to restart the
fabric monitor for them to be applied.
icon to apply your changes. If you update the connectivity settings you will need to restart the
fabric monitor for them to be applied.
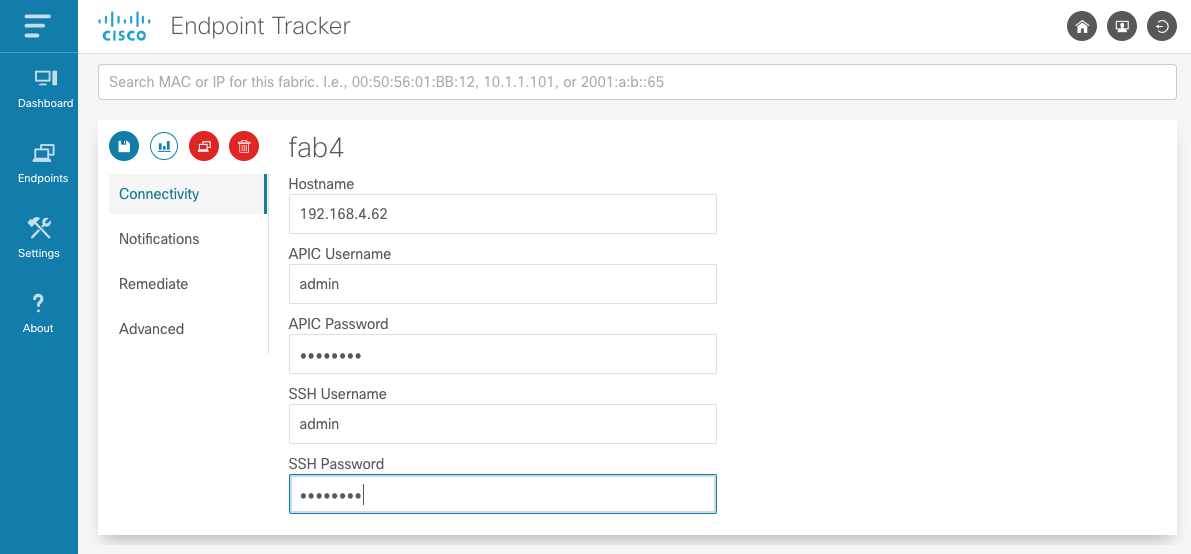
Connectivity
Note
APIC hostname and API credentials are auto detected in app mode and cannot be changed.
Connectivity settings containing hostname and APIC credentials are required to access the fabric. An APIC username with admin role on the all security domain is required. SSH credentials are only required if clear endpoint functionality is required. For ssh, a user with admin read role is required. When settings are saved the credentials are checked and an error is displayed if the credentials are invalid
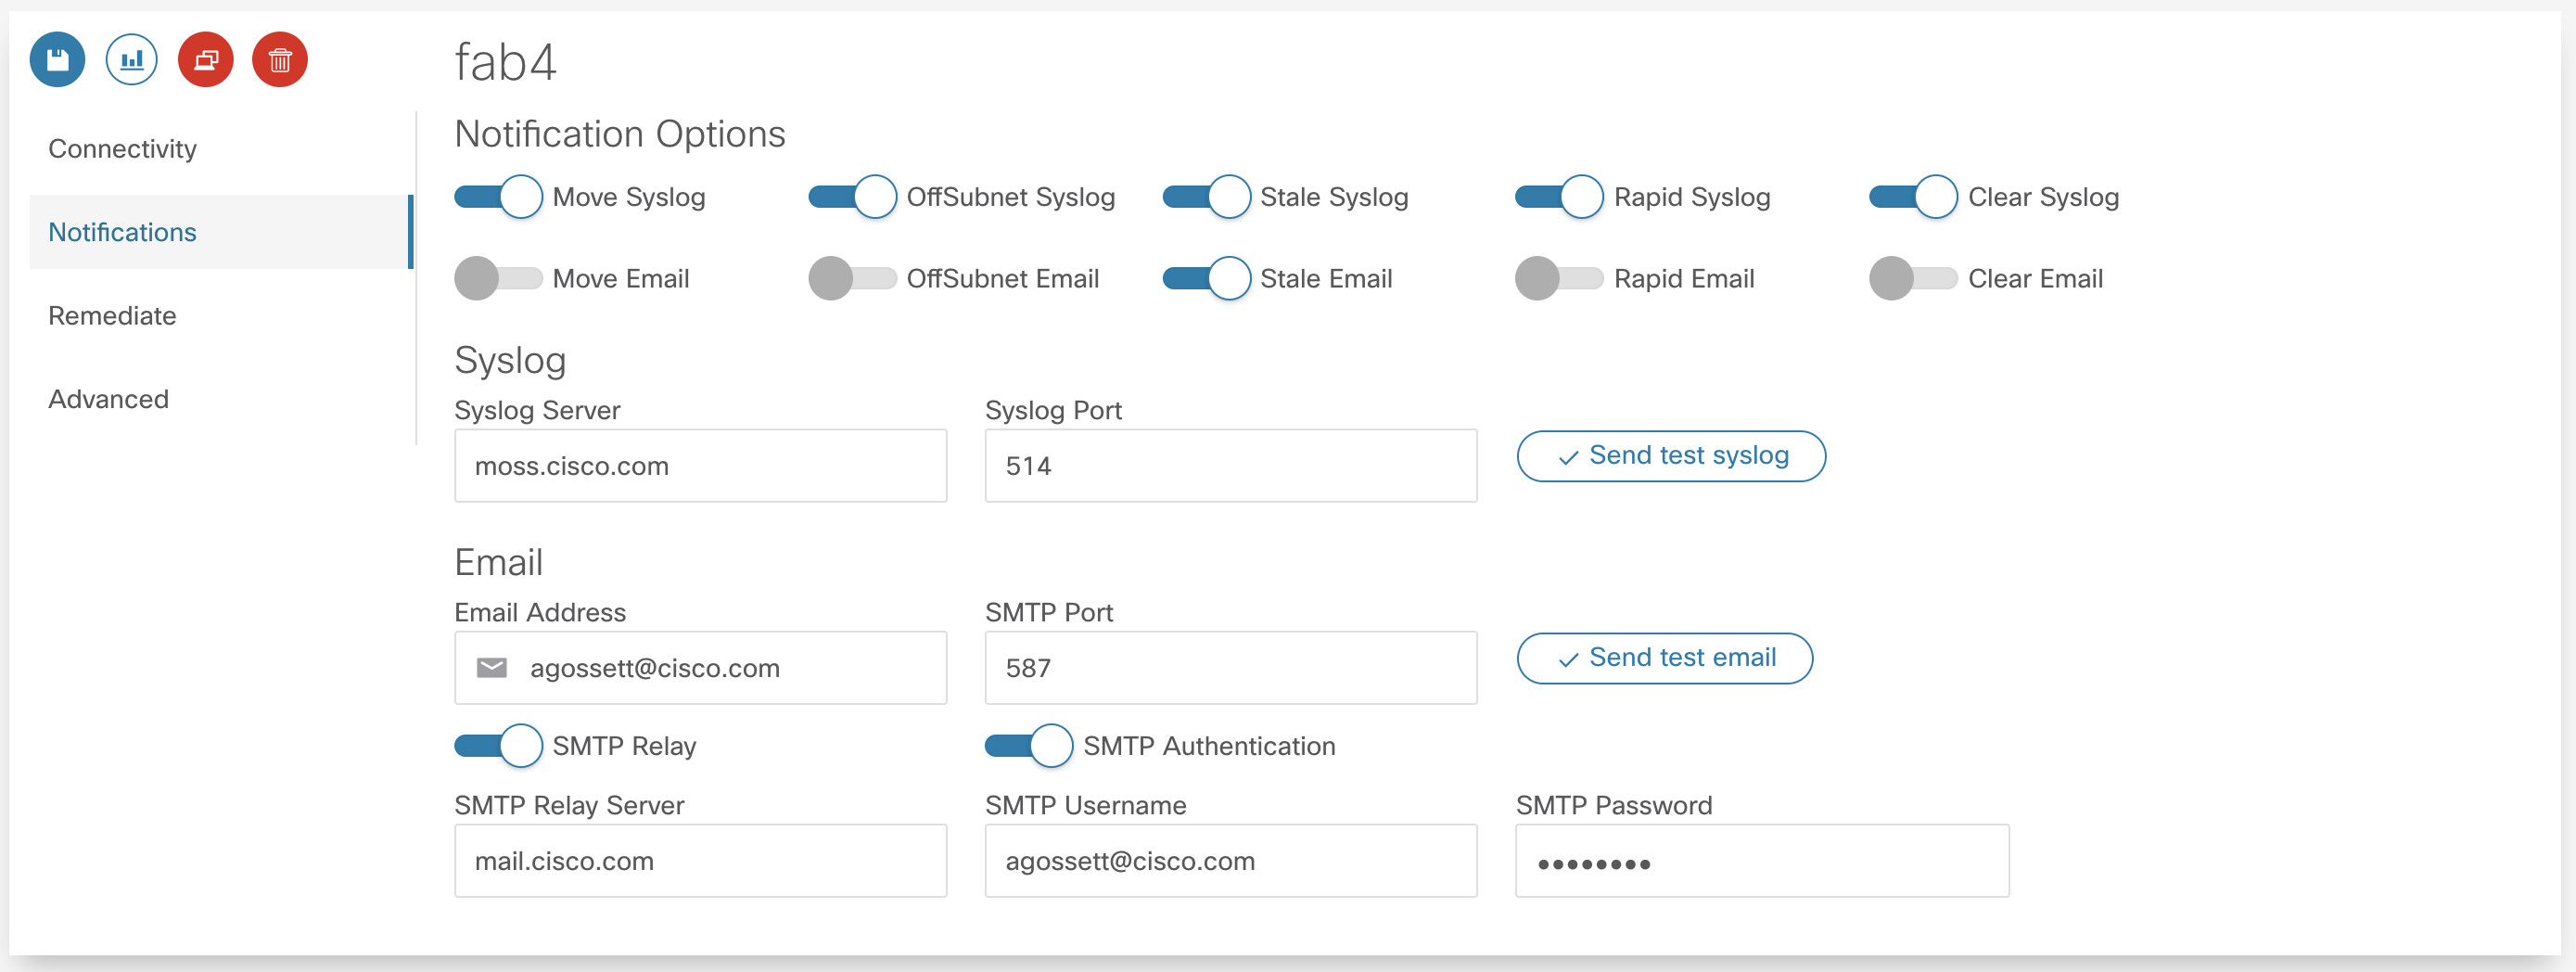
Notifications
There are very flexible notification options. Users can choose to be notified via syslog and email for each of the analysis and detection mechanisms available. Once you’ve saved the settings you can test both syslog and email servers by clicking the Send test syslog and send test email buttons, respectively.
By default email notifications are sent directly to the mail server corresponding to configured email address. By default SMTP messages are sent on port 587 with TLS encryption but can be configured for standard port 25 or any required custom port. Many public mail exchanges will not accept email directly from unknown hosts. You can configure email notifications to be sent through an SMTP relay along with required SMTP authentication.
In the example below, syslog notifications are generated for all events and an email is sent if a stale endpoint is detected.
Syslog/Email Requirements
Syslogs and Email notifications are sent from the eptWatcher process. There are one or more
DNS lookups performed before the message is sent. The following ports need to be allowed:
Syslog
- DNS lookup (UDP port 53) for A-record of syslog server
- Syslog frame (UDP port 514 or custom configured port)
- DNS lookup (UDP port 53) for MX-record of email servers to reach configured email domain
- DNS lookup for corresponding A-record of each returned email server
- SMTP (TCP port 587 or custom configured port) connection to send the email to the selected email server
Note
When executing in app mode, the container is executed on the APIC and the source IP of syslog/email notifications will be translated to the APIC inband or out-of-band address. When running in standalone mode, the IP will be from the docker host.
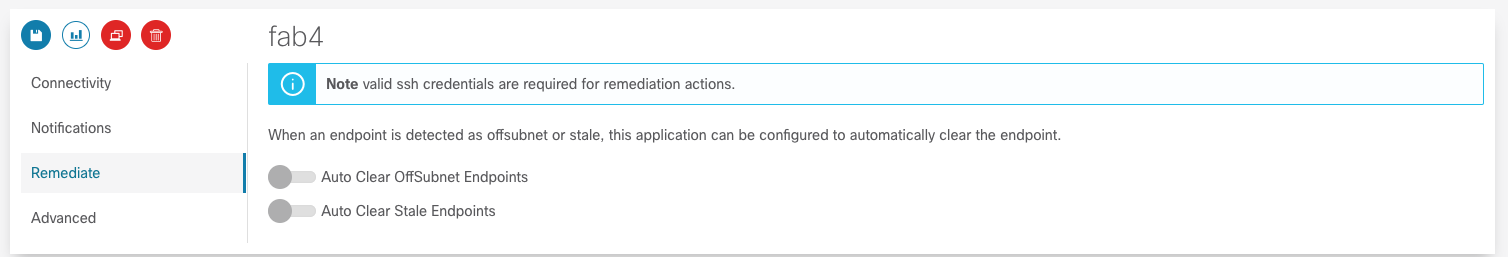
Remediate
The application can be configured to automatically remediate offsubnet or stale endpoints. By default, auto-remediation is disabled.
Remediation is performed by opening an ssh connection to the affected leaf and issuing an epm clear command to delete the endpoint. Ssh credentials are required to perform this action. When an endpoint is cleared there is an entry logged to the Remediation database and a notification may be sent. Fabric operators have full visibility into what clear events have occurred.
Advanced
There are several nerd knobs available to affect how the app is running. The default settings are suitable for most deployments. However, there may be scenarios where this settings need to be updated. The following settings are available within the Advanced section.
If you are using the API then these settings would apply to fabric and eptSettings objects.
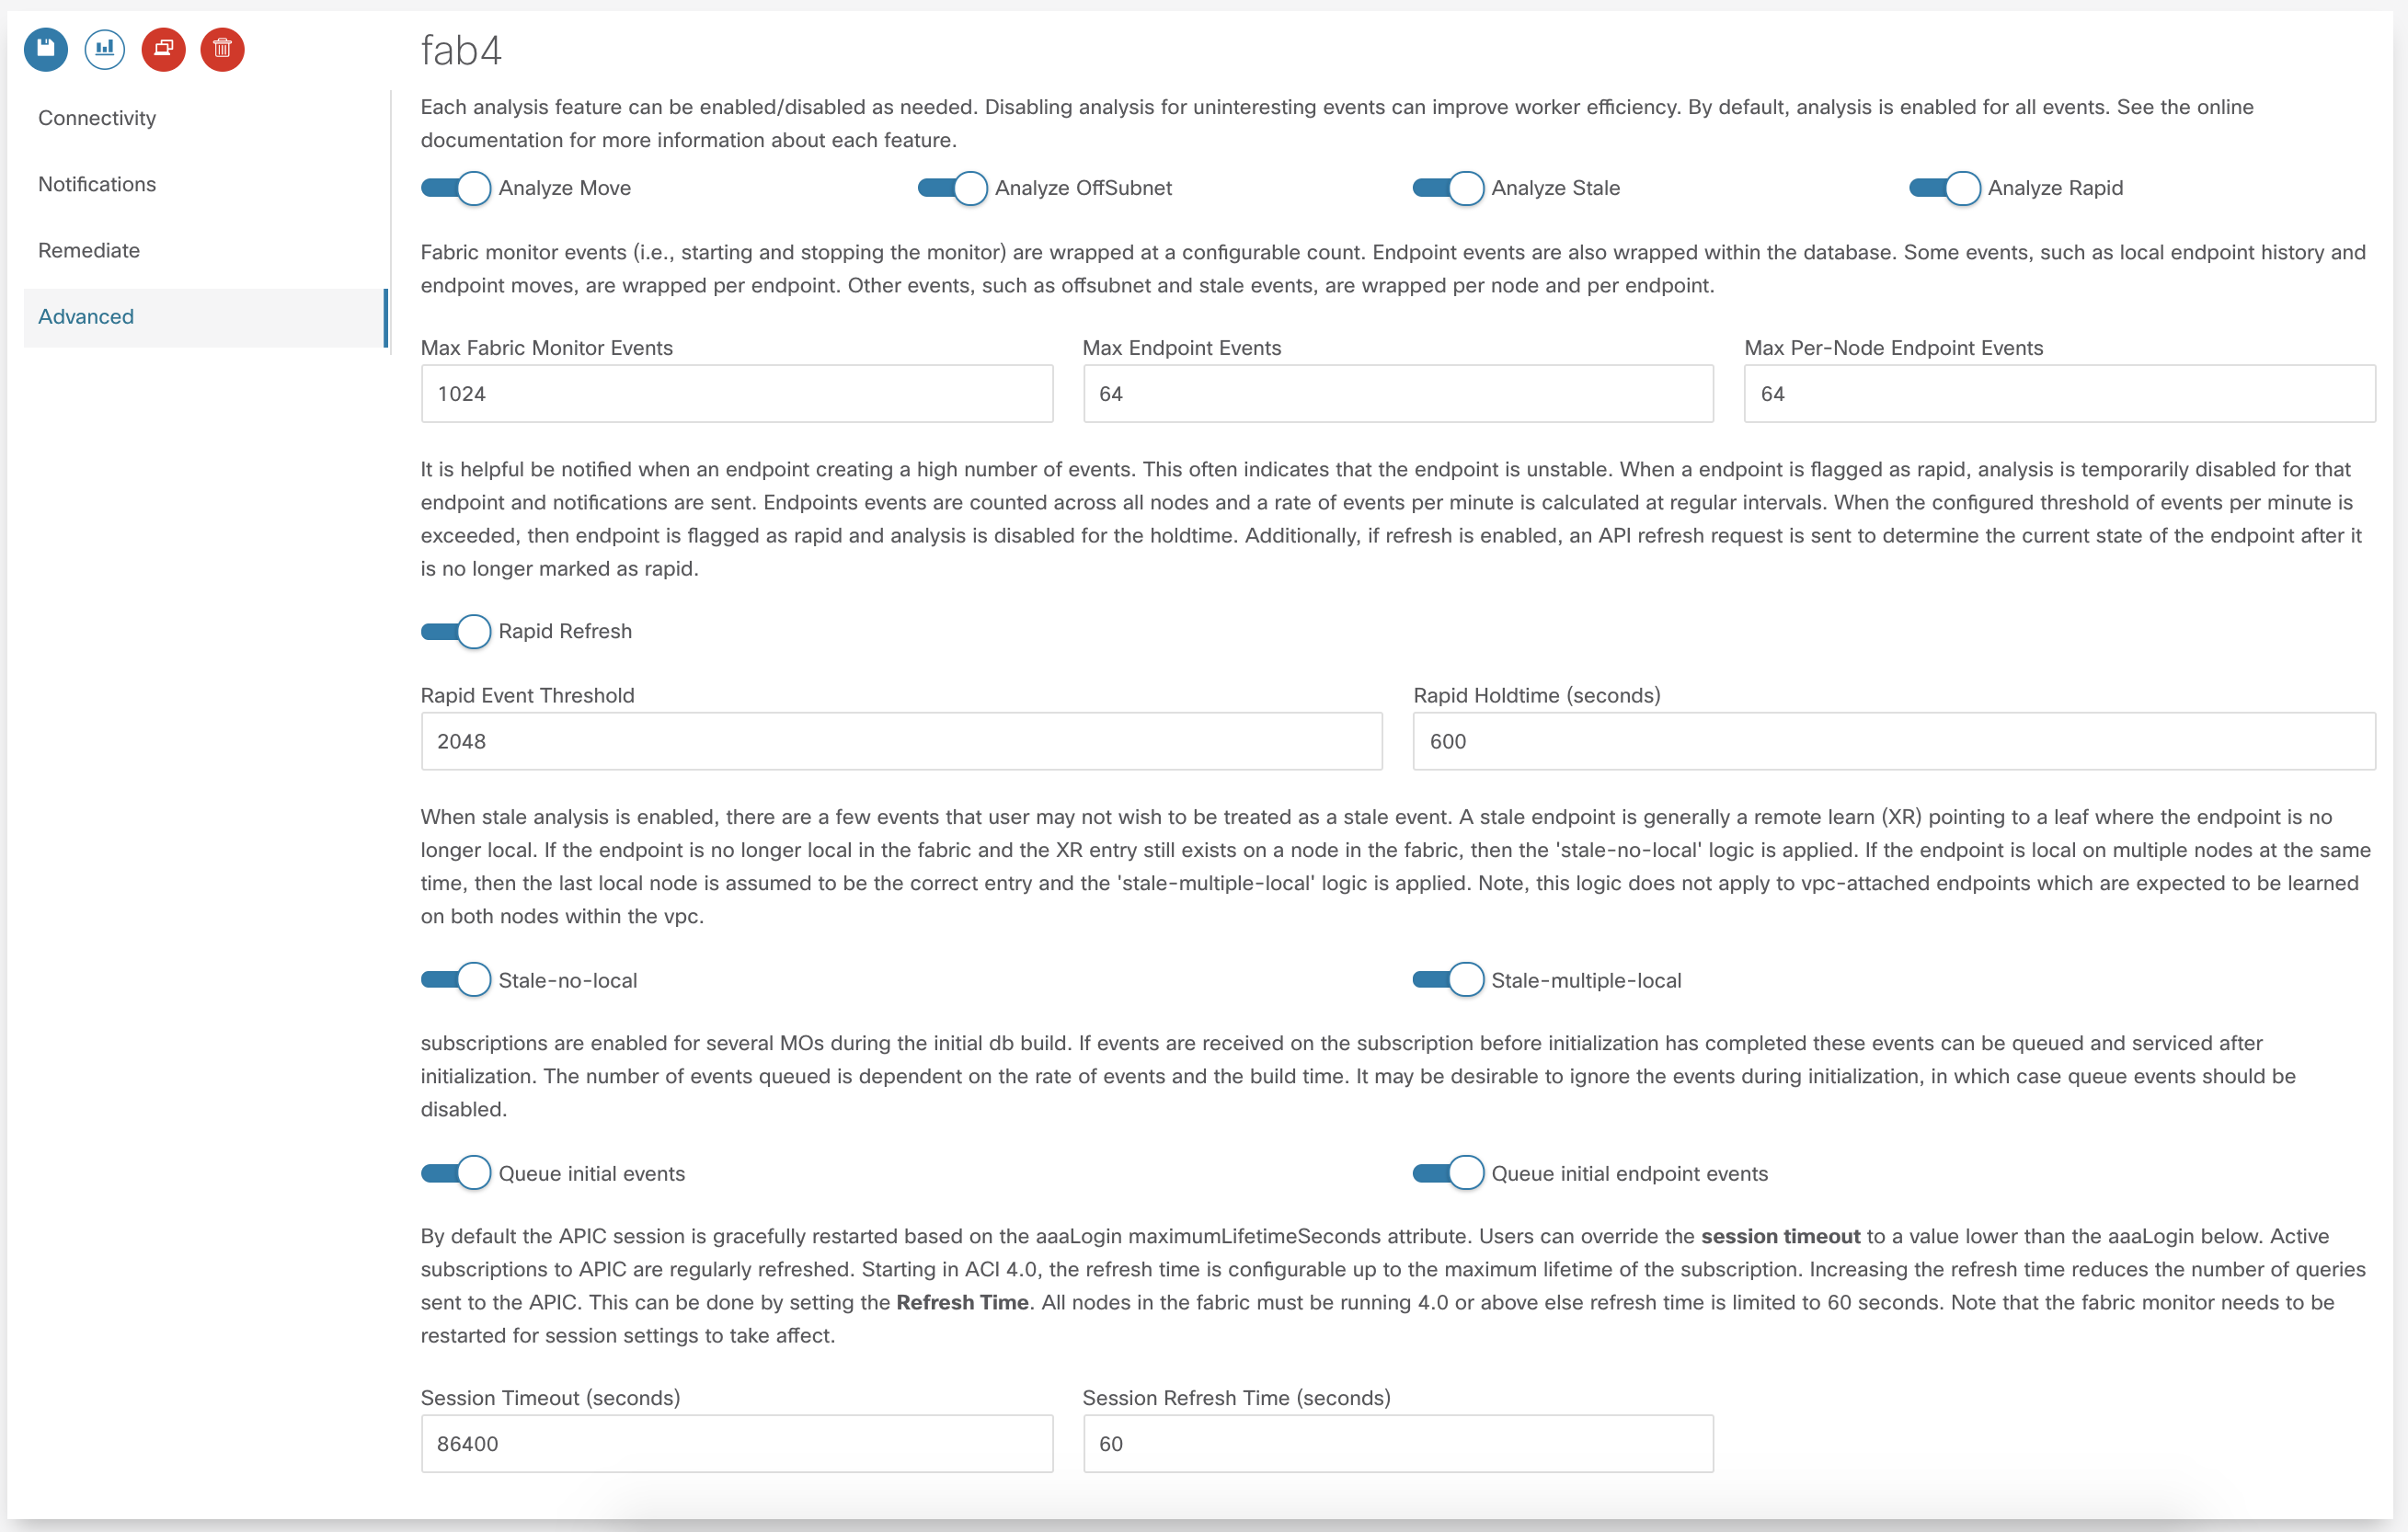
Enable/Disable Specific Analysis
Each analysis feature can be enabled/disabled as needed. Disabling analysis for uninteresting events can improve worker efficiency. The following analysis is available:
- Move tracks move events within the fabric. When a move is detected, an event is added to the eptMove table and an optional notification is sent.
- Offsubnet analysis keeps track of all configured fvSubnet/fvIpAttr objects in the fabric and corresponding mapping to fvAEPg/fvBD. When an IP learn occurs, the vrf VNID and pcTag from the endpoint are used to derive the originating EPG and corresponding BD. The IP is checked against all subnets configured for that BD and if it doesn’t match it the endpoint is flagged as offsubnet. This mechanism can be used for both local (PL/VL) learns along with remove (XR) learns. When an offsubnet endpoint is detected, an event is added to the eptOffsubnet table and the is_offsubnet flag is set for the endpoint in the eptEndpoint table.
- Stale analysis tracks where in the fabric an endpoint is locally learned. When a new learn is seen on a node, it is cross referenced to where it is expected to be learned. If the learn does not point to the expected leaf (or leaf-pair in the case of vPC) then the endpoint is flagged as stale. Note, stale analysis also includes the appropriate logic to handle bounce/bounce-to-proxy scenarios. When a stale endpoint is detected, an event is added to the eptStale table and the is_stale flag is set for the endpoint in the eptEndpoint table.
- Rapid analysis is a mechanism that counts the number of events received across all nodes for a single endpoint. If the number of events per minute exceed the configured threshold, then the endpoint is flagged as rapid and further events from this endpoint are ignored until the rapid hold-down timer have expired. Rapid analysis helps operators quickly determine if an endpoint is unstable in the fabric. Additionally, it protects the app from processing excessive events from an unstable endpoint. When a rapid endpoint is detected, an event is added to the eptRapid table and the is_rapid flag is set for the endpoint in the eptEndpoint table.
Event Count
Fabric monitor events (i.e., starting and stopping the monitor) are wrapped at a configurable count. Endpoint events are also wrapped within the database. Some events, such as local endpoint history and endpoint moves, are wrapped per endpoint. Other events, such as offsubnet and stale events, are wrapped per node and per endpoint. Users can set the following thresholds:
- Max Fabric Monitor Events the maximum number of fabric monitor events to keep. If the threshold is exceeded then older events are discarded.
- Max Endpoint Events the maximum number of endpoint events to keep. This applies to several endpoint tables such as eptEndpoint, eptMove, and eptRapid.
- Max Per-Node Endpoint Events the maximum number of per-node endpoint events to keep. This applies to all endpoint tables that are keyed per node. This includes eptHistory, eptOffsubnet, eptStale, and eptRemediate.
Rapid Endpoint Paramaters
It is helpful be notified when an endpoint is creating a high number of events. This often indicates that the endpoint is unstable. When a endpoint is flagged as rapid, analysis is temporarily disabled for that endpoint and notifications are sent. Endpoints events are counted across all nodes and a rate of events per minute is calculated at regular intervals. When the configured threshold of events per minute is exceeded, the endpoint is flagged as rapid and analysis is disabled for the holdtime. If refresh is enabled, an API refresh request is sent to determine the current state of the endpoint after it is no longer marked as rapid.
- Rapid Event Threshold number of events per minute before an endpoint is marked as rapid.
- Rapid Holdtime is the number of seconds to ignore new events from an endpoint marked as rapid.
- Rapid Refresh, when an endpoint is no longer rapid the state of db is out of sync from the fabric. When endabled, a refresh is triggered to determine the current state of the previously rapid endpoint.
Stale Analysis
When stale analysis is enabled, there are a few events that user may not wish to be treated as a stale event. A stale endpoint is generally a remote learn (XR) pointing to a leaf where the endpoint is no longer local. If the endpoint is no longer local in the fabric and the XR entry still exists on a node in the fabric, then the ‘stale-no-local’ logic is applied. If the endpoint is local on multiple nodes at the same time, then the last local node is assumed to be the correct entry and the ‘stale-multiple-local’ logic is applied. Note, this logic does not apply to vpc-attached endpoints which are expected to be learned on both nodes within the vpc.
- Stale-no-local enable stale-no-local detection
- Stale-multiple-local enable stale-multiple-local detection
Startup Event Queueing
This app heavily leverages subscriptions for keeping the app db in sync with the APIC. When the fabric monitor is started it needs to build the initial db state and setup appropriate MO subscriptions. It is possible that changes are occurring during the initial build. To capture these events, the subscriptions are started before the MO builds. After the build completes, any event received is then analyzed.The number of events queued is dependent on the rate of events and the build time. It may be desirable to ignore the events during initialization, in which case queue events can be disabled.
- Queue initial events enables queueing of all standard MO events during build
- Queue initial endpoint events enables queuing of all EPM events during endpoint build
Subscription Heartbeats
The subscription process monitors the health of the websocket and manages login token and subscription refreshes. It also polls the APIC at a regular interval to ensure that the nginx process is reachable and responsive. There is a query sent with a hearbeat timeout once per heartbeat interval. If there are consecutive heartbeat failures, up to the configured heartbeat retry count, then the APIC is marked as unreachable and the subscription process will restart. Set the heartbeat interval to 0 to disable heartbeat functionality.
Note
The fabric monitor needs to be restarted for heartbeat settings to take affect.
- Heartbeat Retries maximum number of successive heartbeat failures before APIC connection is declared unusable and subscription thread is closed
- Heartbeat Interval interval in seconds to perform heartbeat query to ensure APIC connection is available and responsive. Set to 0 to disable heartbeat.
- Heartbeat Timeout timeout in seconds for a single heartbeat query to complete
Session Handling
By default the APIC session is gracefully restarted based on the aaaLogin maximumLifetimeSeconds attribute. Users can override the session timeout to a value lower than the aaaLogin lifetime by setting a limit on the session time. Starting in ACI 4.0, the refresh time is configurable up to the maximum lifetime of the subscription. Increasing the refresh time reduces the number of queries sent to the APIC. This can be done by setting the Refresh Time. All nodes in the fabric must be running 4.0 or above else refresh time is limited to 60 seconds.
Note
The fabric monitor needs to be restarted for session settings to take affect.
- Session Timeout maximum time in seconds before new login and websocket is started for APIC session
- Subscription Refresh Time time in seconds between subscription refreshes.